Last Updated / Reviewed: 02/11/2024
Execution Time: 30 mins – 1 hour
 Goal: To successfully incorporate Heatmaps on your analytics strategy.
Ideal Outcome: Your business is now correctly recording, logging and analyzing your heatmaps.
Prerequisites or requirements:
To fully follow this SOP, you will need Google Tag Manager set up on your website. If you don’t have Google Tag Manager set up on your website, you will want to follow the procedure covered in SOP 004 (web version) for WordPress sites, SOP 065 (web version) for Shopify sites, or SOP 066 (web version) for Squarespace sites.
Why this is important: In-page behavioral analysis gives your team additional visual insights that are not easily collected or interpreted using traditional analytics tools such as Google Analytics.
Where this is done: In Google Tag Manager, Hotjar, and Google Spreadsheets.
When this is done: You will set up a heatmap every time you want to learn more about your user’s on-page behavior on a different page or set of pages.
Who does this: The person responsible for Analytics or Conversion Rate Optimization (CRO).
Included Resources on this SOP
Clickmap & Scrollmap Diagnosis Cheat Sheet
Evaluating the need for a Clickmap or Scrollmap tool
- Do you want to analyze quantitative data, analyze specific metrics over given time periods, or track major events on your website?
- If yes, a tool like Google Analytics is more suitable for your analysis. Even though in some cases you can get similar indicators visually through a heatmap, typically this kind of results.
- If you don’t have Google Analytics on your website yet, you can set it up by following SOP 009 (web version) for WordPress or SOP 067 (web version) for Shopify.
- If you have Google Analytics but haven’t set up the right goals and events to track your business you can do so by following SOP 021 (web version).
- If yes, a tool like Google Analytics is more suitable for your analysis. Even though in some cases you can get similar indicators visually through a heatmap, typically this kind of results.
- Do you want to analyze how your users are interacting within a specific page or subset of pages?
- If yes, in some cases you might be able to do so with Google Analytics. But mostly the data will be much easier to analyze by visually looking at scrollmaps and clickmaps.
Deciding what pages to record
- Identify core pages on your website and setup page-level heatmaps for them, those are the pages most users will go through before performing the action you want them to perform, example:
- Homepage;
- Lead generation landing page;
- Pricing page;
- Sales Page;
- Checkout page or checkout steps;
- Identify supporting pages that provide clues regarding what might be going through your user’s mind:
- Example:
- FAQ page – If you’re using accordion-style elements, will give you insights regarding what questions are more common allowing you to improve your landing page copy by visually seeing which questions are clicked on the most.
- Category selection page – If you have a page where users click on specific categories of your website you can quickly and visually assess what categories are more popular among that set of users.
- Portfolio – If you use a single page portfolio, check if users are seeing your best projects, identify if they are trying to click on any of those to identify the most interesting ones.
- Features page – Identify features users are more interested in.
- If you are in the process of redesigning a specific page or a template:
- Create a heatmap of the old version;
- Create a heatmap of the new version;
- Analyze high potential poorly performing pages:
- High Volume / High Bounce Rate: Open Google Analytics → On the sidebar click ‘Behavior’ → ‘Site Content’ → ‘All Pages’ → Sort by ‘Unique Page Views’ → Identify the pages where the Bounce Rate is unusually high compared to the other ones.
Creating and setting up an account with Hotjar
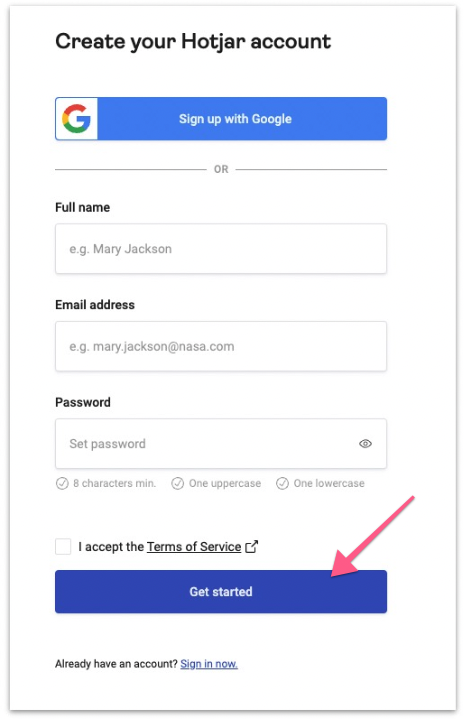
- Click here and register your your email.
- Enter your details, accept the terms of service, and click the ‘Get Started’ button. If you choose to sign up with your Google account instead, you will be taken directly to the Hotjar set up.
- You will be prompted to enter your personal details.
- Enter your ‘Role’, select ‘Yes’ If you want to use this account to manage clients, or ‘No’ if this is for your website only, your organization name, and click ‘Next’.
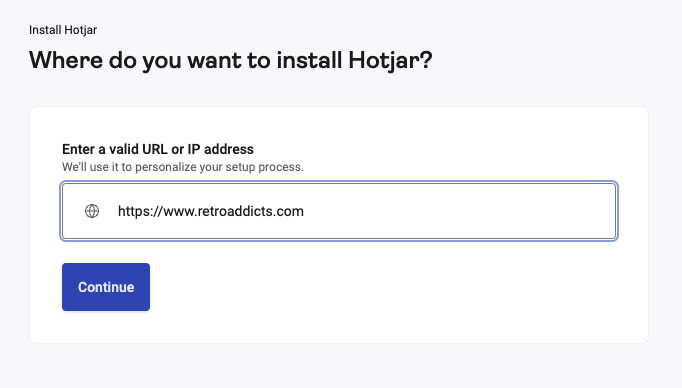
- The next page will ask you ‘Where do you want to install Hotjar?’ Enter your site URL → Click the ‘Continue’ button.
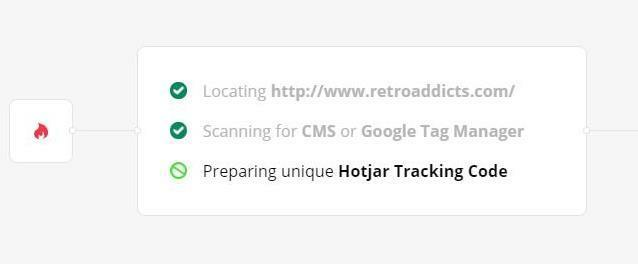
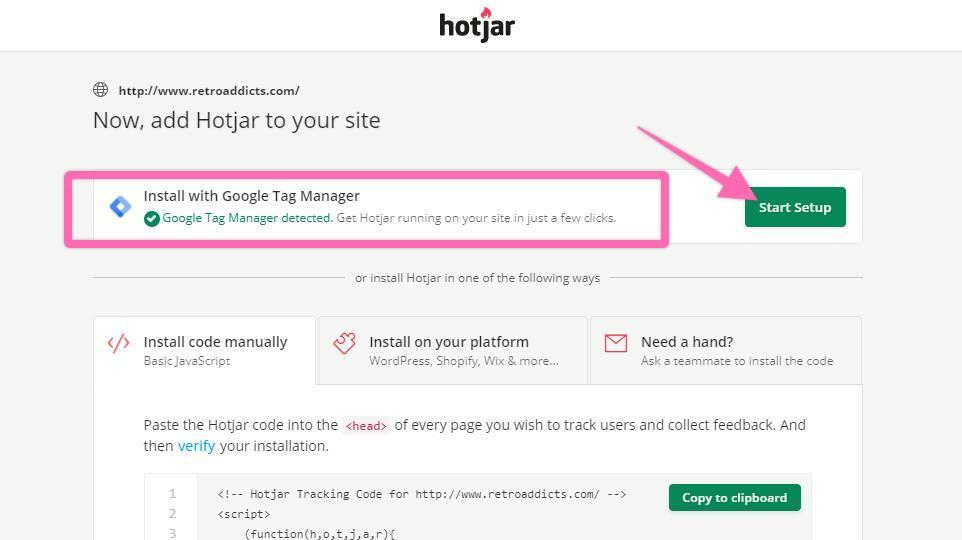
- Hotjar will now detect if you have Google Tag Manager installed.
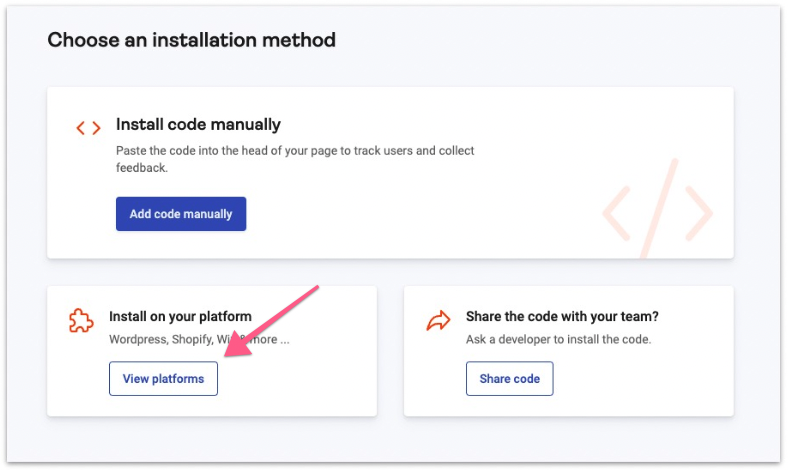
- In the next step, select “View platforms” and select Google Tag Manager.
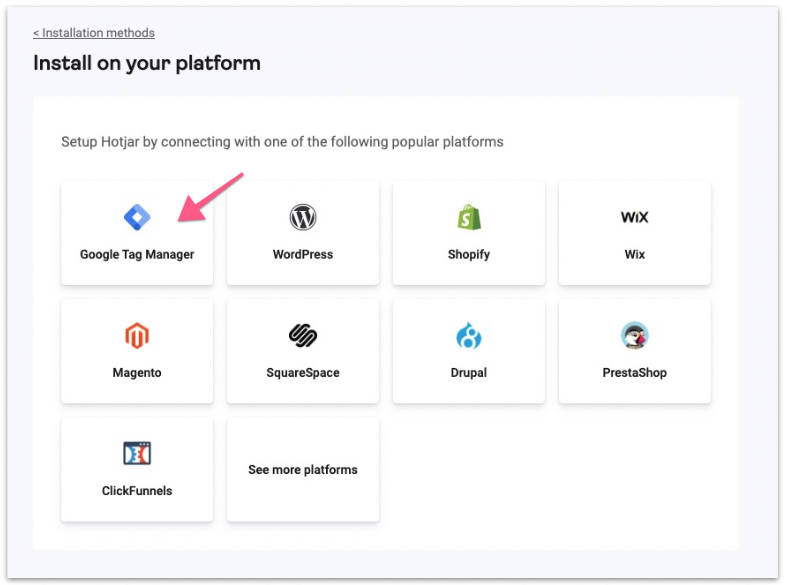
Installing Hotjar using Google Tag Manager
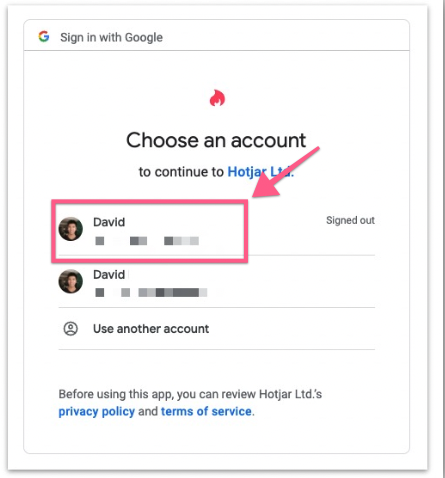
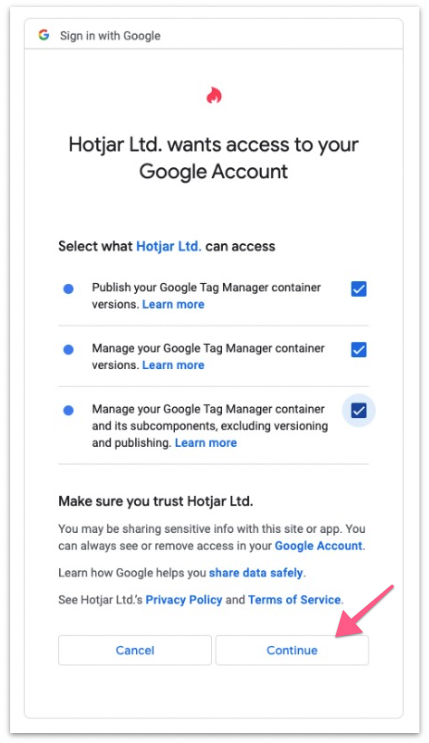
- After clicking “Google Tag Manager,’ Hotjar will redirect you to your Google Account so that it can access your account – check on all three and click ‘Continue.’
- Grant Hotjar access to your Google Tag Manager account and click “Continue”.
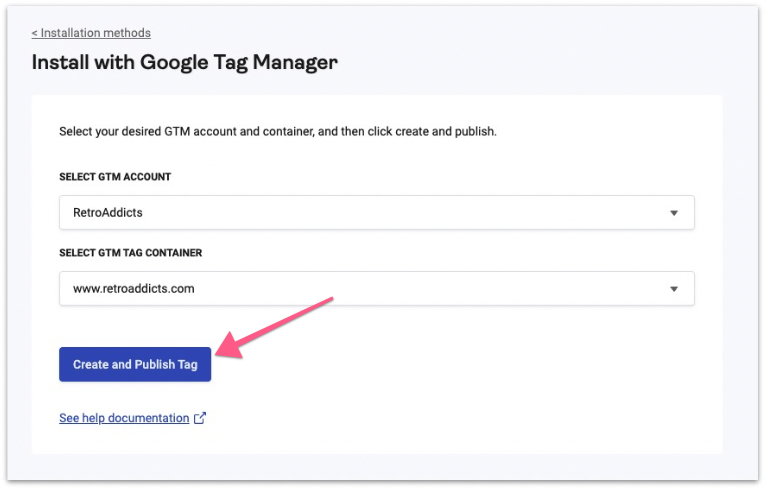
- Select your GTM Account and GTM Tag Container from the dropdown, then click ‘Create and Publish Tag’ button.
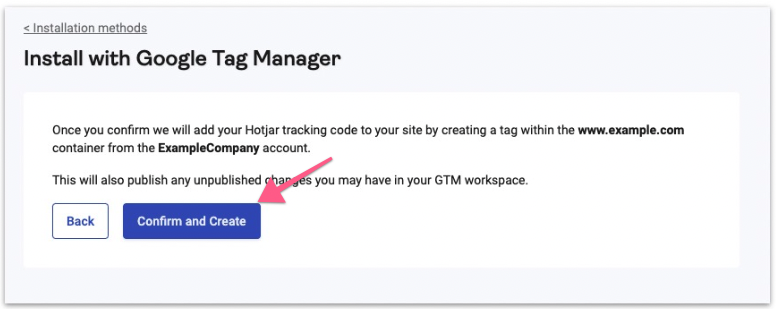
- Click the ‘Confirm And Create’ button.
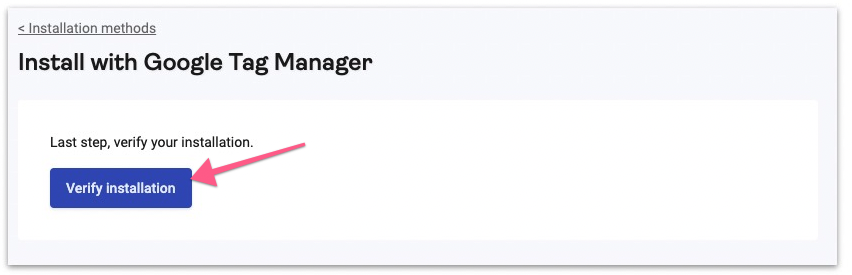
- The next step is to verify your installation, just click the button. This step might take more than 60 seconds.
- Add your URL to verify the installation.
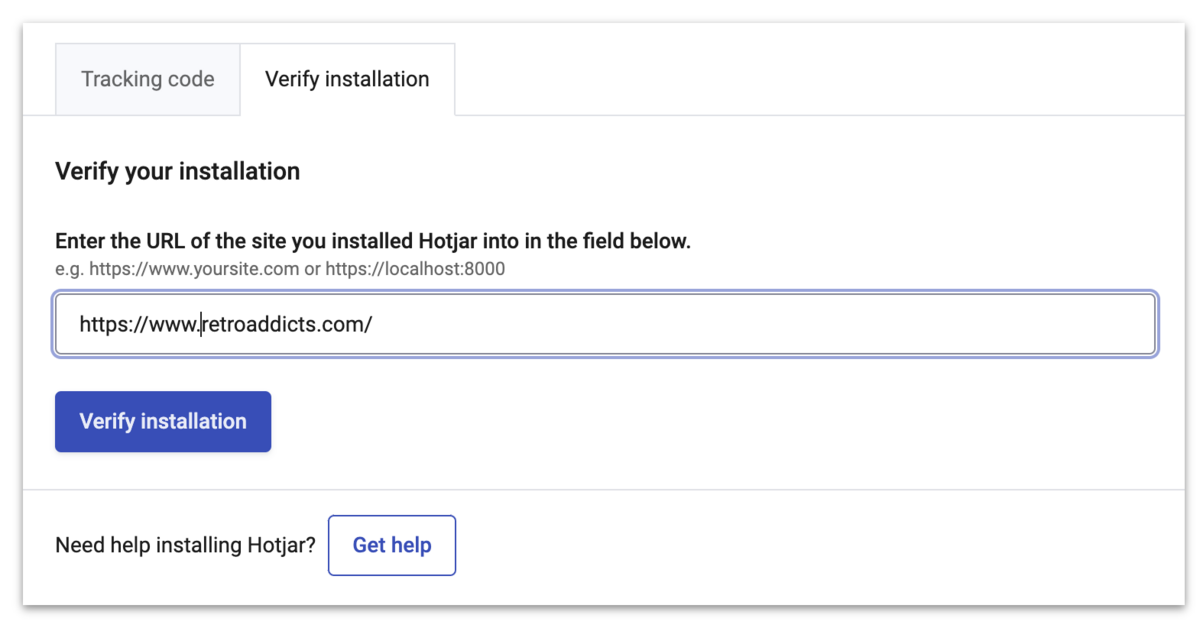
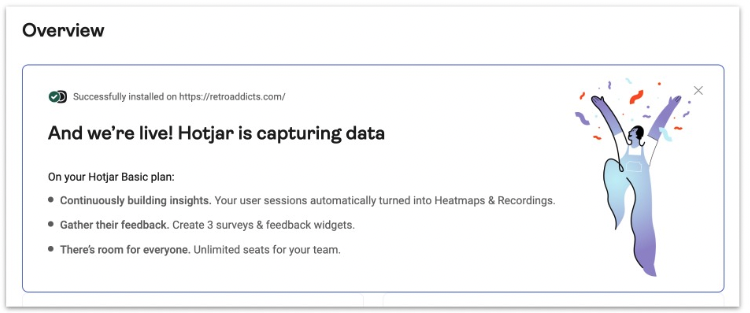
- There might be some delays/unsuccessful results in verifying, just retry. Eventually, it will redirect you to the Hotjar Dashboard, meaning that Google Tag Manager has been successfully integrated with Hotjar.
Verify the Hotjar Tag in Google Tag Manager
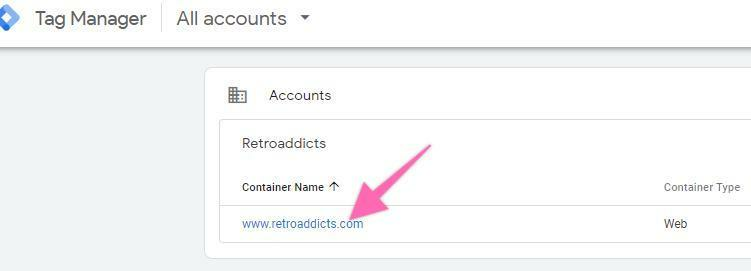
- Go to http://tagmanager.google.com and sign in with your account details.
- Select the ‘Container Name’ that is set up on your website.
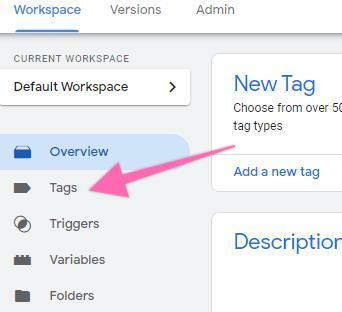
- Click on ‘Tags’ in the left side bar of your workspace.
- In your most recent tags, you will see the ‘AUTO Hotjar Tracking Code’ that was automatically added by Hotjar in the previous steps.
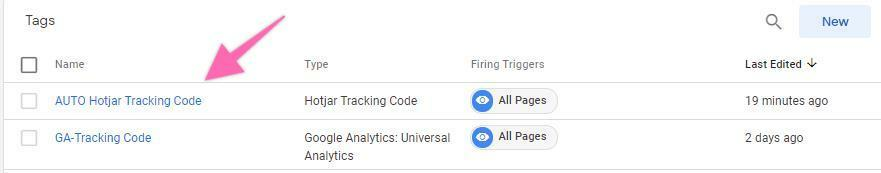
- [Optional] You might want to rename the tag to match the naming convention used in your GTM account.
- Note: When creating new tags it’s recommended to define a naming convention from the beginning, this keeps your Google Tag Manager set up neatly organized and easy to maintain for many years to come.[Abbreviated Name Of Tool]_[Use for this tag] is a good start.
- e.g: “HJ_TrackingCode”
- Note: When creating new tags it’s recommended to define a naming convention from the beginning, this keeps your Google Tag Manager set up neatly organized and easy to maintain for many years to come.[Abbreviated Name Of Tool]_[Use for this tag] is a good start.

Setting up and viewing Heatmaps
- Once you’ve added your Hotjar tracking code. Hotjar will automatically record user sessions and heat maps on your site. This is known as continuous tracking. You no longer need to set up heatmaps for individual page.
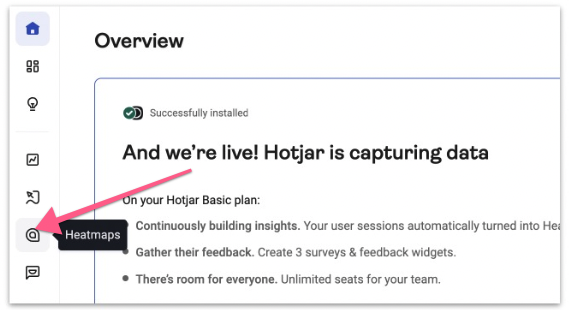
- To view existing heatmaps on your site. Click the ‘Heatmaps’ icon on the sidebar.
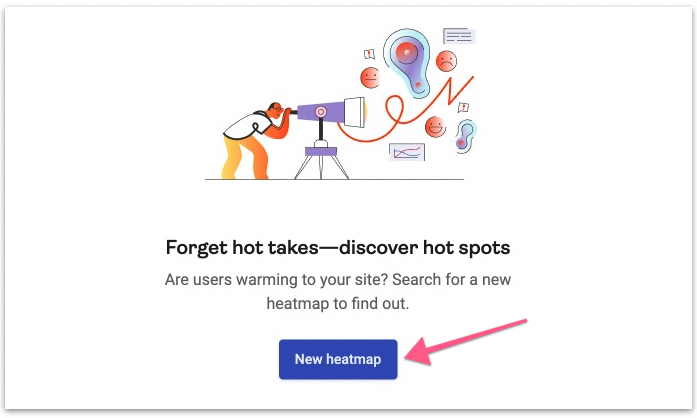
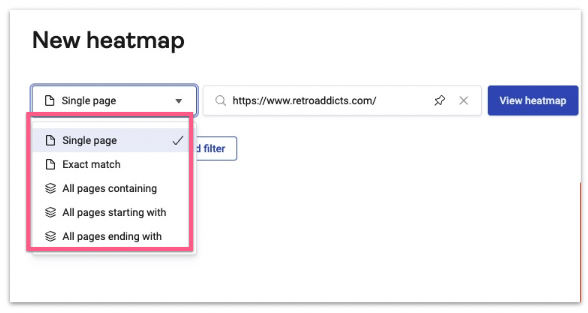
- It will direct you to the Heatmap dashboard page. Click “New heatmap”.
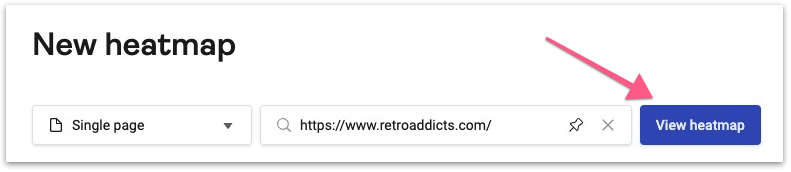
- Enter your page URL to view heatmap.
Note: You will only be able to view heatmaps on pages where the Hotjar tracking code is installed. The heatmap may not be available until 24 hours after installation as they’re collecting user sessions and generating heatmap for your site.
- You should then be able to see the heatmap generated on your page.
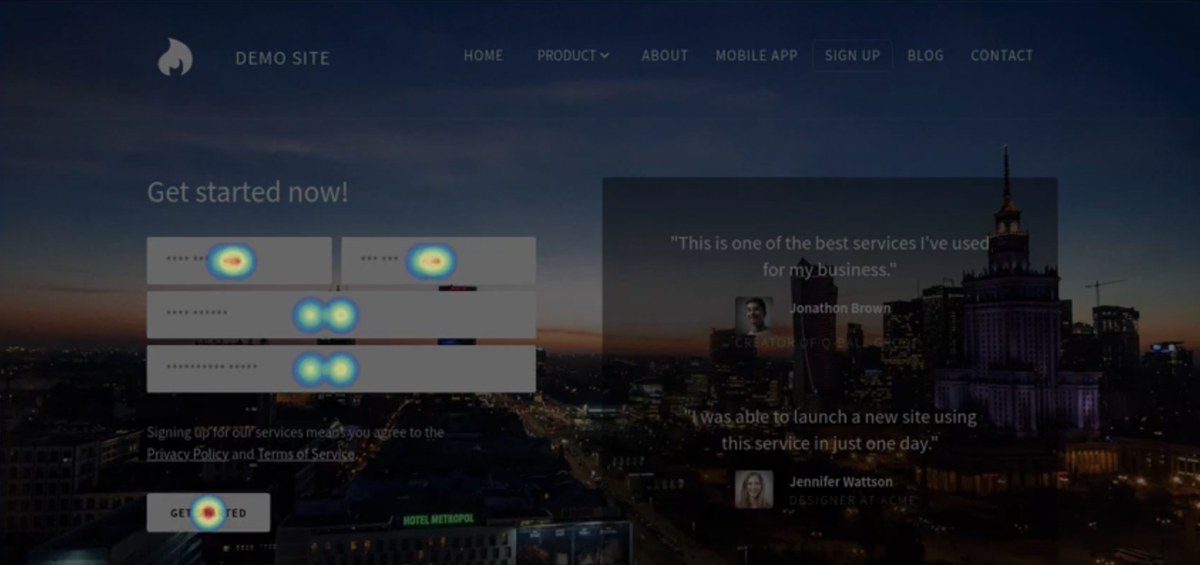
- You then have the option to set different page rules to view different heatmap on your site.
Excluding internal traffic from your heatmaps
- If you have a static IP address, are already connected to the network that you want to exclude from your heatmaps (e.g.: your office network) and are not using a VPN, skip to “Excluding an IP address of a network”
- If you’re not sure about any of these: skip to “Excluding an IP address of a network”
Excluding your current IP address:
- On your browser go to https://insights.hotjar.com/settings/ip
- Scroll down to ‘IP Blocking’ and click ‘Block Your Current IP’
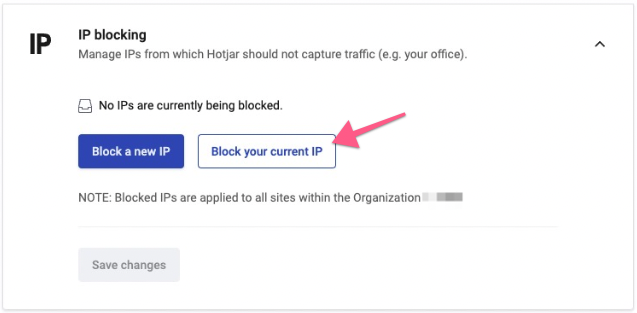
Then, ‘Save Changes.’
Excluding an IP address of a network:
- Identify the IP addresses that you want to exclude:
- Option 1: Ask the person responsible for your office’s network or your ISP (Internet Service Provider):
- Is our network IP Address static? If your IP address is not static, excluding it from your Heatmaps will not be a long-term solution.
- What is our external IP address? This is the IP address that you need. Take note of it.
- Option 2: Check it yourself (or send these instructions to someone who’s network you want to exclude such as an employee’s home network If he works remotely):
Note: Make sure you are not using a VPN. If you are not sure, ignore and ask the person responsible for IT in your organization. If you’re using your personal computer (or are fully aware of the software in your computer) and have not installed any VPN software proceed with this method.
- Connect to your local network. (Usually, you just need to be connected to the Wi-Fi of the network you want to exclude)
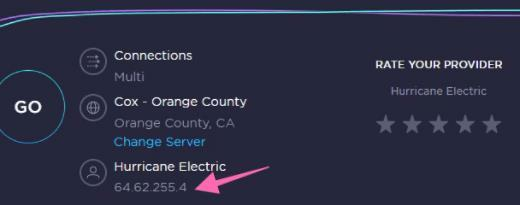
- Go to http://beta.speedtest.net/
- Locate your IP address on the page:
- Call your ISP and ask them if your network’s IP address is static.
- Note: If you want to exclude your local IP address, your Office’s IP address must be static.
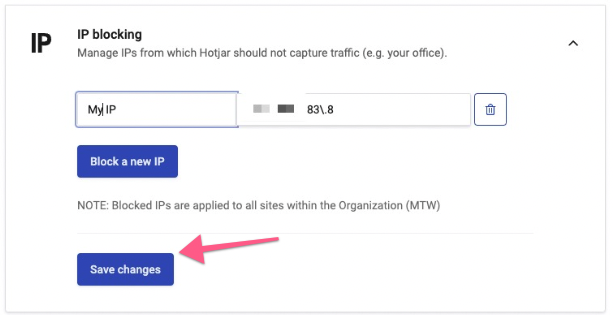
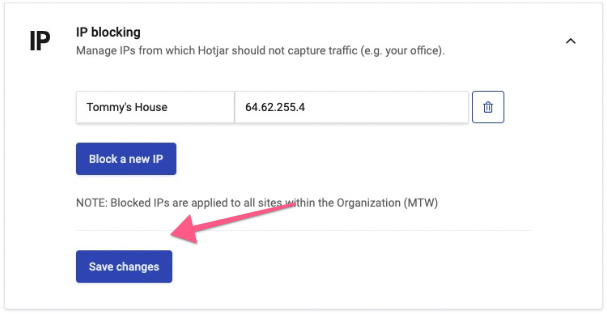
- On your browser go to https://insights.hotjar.com/settings/ip
- Enter an internal name for that IP Address
- Example: “Tommy’s house”
- Click ‘Save Changes’.
- That’s it! Now repeat this procedure for all the networks that you or your employees may use to access your website.
Example: Your office network, your home network, your employee’s home networks, etc.
Analyze your recordings
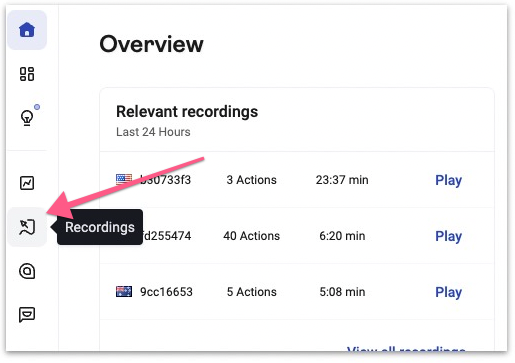
- Log in to your dashboard.
- On the sidebar click “Recordings”.
- Open the Clickmap & Scrollmap Diagnosis Cheat Sheet .
- Go through each of the ‘Indicators’ and identify which ones apply to your heatmap.
- Log the results of your recordings by following the steps on the next chapter.
Log the results of your recordings
Important: Make sure no changes were made to the pages that are collecting data between the “Start” and the “End” date of your heatmaps.
- Example: If your homepage has multiple CTA’s and you change them frequently every day. If the data for the heatmaps and scrollmaps is being collected throughout a whole month your data will not be meaningful since the target page changed multiple times while the clickmaps were being collected.
- Open the Scrollmap and Clickmap Insights Spreadsheet .
- Fill in each cell:
- Start date: The date you started collecting data.
- End date: The date your heatmap stopped collecting data (either because you stopped it or because it reached the number of pageviews that were setup).
- Segment: If you are only recording a specific segment of your traffic (e.g. you are only collecting data on Facebook traffic), enter it here.
- Page Analyzed: The URL of the page or group of pages being recorded.
- Level: Select ‘Page’ if you are recording a single specific page. Select ‘Template’ if you are not evaluating a specific page content but a template instead.
- Reasons for recording: If there was a specific reason why you felt like you should analyze that page enter it here. Typically, you should have a reason for it. E.g.: You might need to place another CTA button at the middle part of the page if you observe that users often do not scroll way down at the bottom of your landing page.
- Original Page: Save a screenshot of your original page and upload that image to a cloud storage service like Google Drive to get a shareable link.
- If you don’t have any way to create that screenshot and are using Google Chrome, ‘Awesome Screenshot’ is a good tool that offers that feature for free.
- Scrollmap and Clickmap:
- Log in to your dashboard .
- On the sidebar click “Recordings”
- Scrollmap and Clickmap:
- If you don’t have any way to create that screenshot and are using Google Chrome, ‘Awesome Screenshot’ is a good tool that offers that feature for free.
- Select your recordings and click “Export.
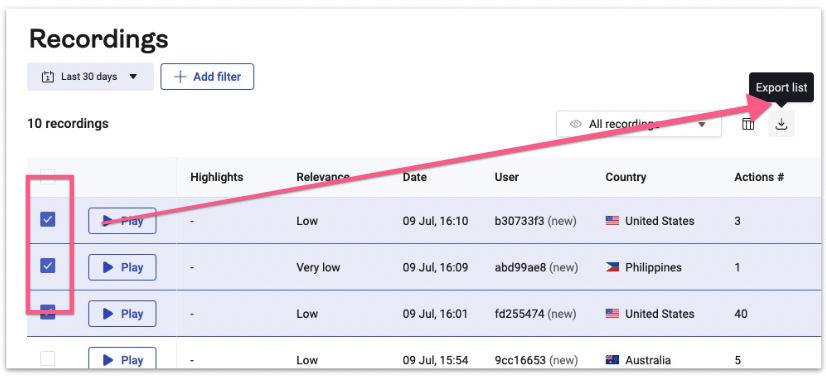
- Save the files Upload those images to a cloud storage service like Google Drive and get a shareable link. (Outside of the scope of this SOP)
- Comments on results: This is where you should summarize your findings based on the Clickmap & Scrollmap Diagnosis Cheat Sheet .
- E.g.: ‘Possible misleading clickable elements. Users are clicking on the images instead of the CTA button’.
- Hypothesis: This is where you come up with a possible reason for the findings you have just logged.
- E.g.: ‘Our image borders make them look like clickable elements.’
- Next Step: Based on your hypothesis you input a possible fix for that issue:
- E.g.: ‘We should try and remove the image borders and better highlight our CTA instead.’
That’s it! You are now ready to implement any changes to the pages and record and log your traffic once again, until you achieve the desired behavior from your users.